
R
Rich Julius
Guest

Rich Julius, Principal Product Manager, Progress Easyl
Product management organizations are often focused on markets and competition, but nothing is more satisfying—and arguably more important—than working with clients to see our products solving real business problems around data analysis. So I take a genuine interest in our customers struggling with data integration challenges, and I often spend hours with a customer making sure that they get the most value they can from Progress® Easyl™.
These customer use cases help me and my colleagues learn more about the real-world applications for Easyl, and we often discover tips that can help other customers. Let me share one of these with you today.
Data Blending from Different Data Sources
I recently worked with a Progress® OpenEdge® customer to help them create analytical reports using Easyl. One thing you quickly discover is that normalized databases aren’t exactly optimized for reporting. So you often have to de-normalize the data, creating views that simplify the reporting process itself, while making it easier to mine, analyze and visualize the resulting data.
Easyl has some great ways to do this. For example, you can create “virtual” data set relationships that join data across tables—even if those tables are in completely different data sources, like an OpenEdge application and Salesforce.com. By joining these tables in the cloud, Easyl enables you to enhance the data in one table with data in a second table.
Easyl Templates to Build Blended Reports
As a practical example, I used Easyl to access the Customer table of an ERP system, which contains basic contact information about each customer account. Then I created a relationship (which is stored in Easyl as part of my “blending template”) between the Customer table and related customer account records in my Salesforce.com Accounts table. As a result, I am now able to augment the Customer table of the ERP system with data from Salesforce—in this case Annual Revenue, Number of Employees, and Website.
This “virtual view” across disparate data sources illustrates just how easy it is to build blended reports when you have the right tools! The following image shows you the customizable template I created.
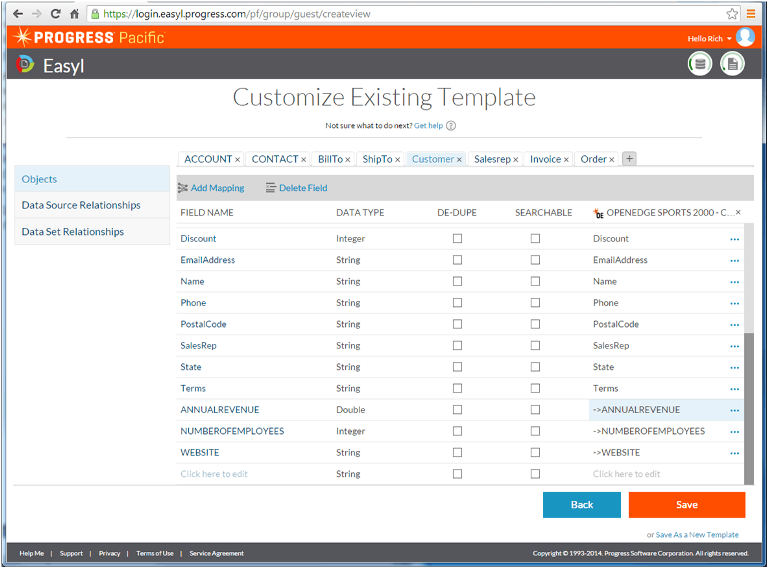
Progress Easyl includes templates that can be customized for easy, fast reporting.
Stay Tuned for More in this Series
You’ll want to stay tuned to this blog for more installments in this new series. You’ll get insider tips on how to do data prep, data cleansing and data analysis easier and faster. Learn more about Easyl now. Or go ahead and get started now with a trial download of Progress Easyl.
Author information
Principal Product Manager, Progress Easyl at Progress Software
Rich is the Principal Product Manager for Progress Easyl, a cloud-based data integration and blending tool that enables you to create reporting data sets and data marts “on-the-fly” quickly and easily. Rich has spent two decades working with data-driven applications and marketing automation, and served in senior management roles at a number of Silicon Valley companies before settling in North Carolina.
Rich has years of experience leading consulting engagements for Fortune 1000 clients that include Cisco, Microsoft, Seagate, and McKesson, and is an alum of PeopleSoft, Oracle, and Informix. Most recently, Rich was nominated by President Barack Obama to serve on the Internal Revenue Service Oversight Board.
| Twitter | Google+ | LinkedIn |
Continue reading...