Question Maximum Database Connections

Question...

We run OpenEdge 10.2a.

It seems like when we get about 4-5 simultaneous database reads via ODBC (read uncommitted) or AppServers, our system slows way down. Is there a logical maximum amount of simultaneous reads that a Progress Database can handle before it has to start queuing jobs up? I can provide more specifics on our setup if needed. Not sure what specs are applicable.

Thanks,
 
Our server has 80 logical cores. 4 Processors, 10 cores per processor, hyper-threaded.
I believe it is an enterprise install. Using it to run our Epicor 9 ERP system.
 
I guess here is what I am trying to theorize... I'm just a beginner at Progress DBA, so please don't flog me too terribly...

It seems like if we get three or four ODBC connections (read uncommitted) or AppServers trying to connect at once, all of the other normal traffic starts to queue up and experience lag. It feels like there is some sort of predetermined amount of database 'connectors' that a Progress database has. So, when two or three are locked up, the few that remain have a much more difficult time satisfying the otherwise normal demand.

Yesterday, we had three ODBC connections (read uncommitted) get locked up on one table in the system that is rarely ever used. Yet, it created such a delay in other users reading other tables that we had to take the database down to clear out the stuck ODBCs.

I'm just trying to understand why it is so fragile on an 80 core box. Anything you could offer up with your real knowledge of Progress would be fantastic and much appreciated.
 

TomBascom

Curmudgeon
Any database is going to have throughput limits and bottlenecks.

Determining where the bottleneck is takes data and experience.

The first bottleneck is usually disk IO ops. Database IO is almost always random, not sequential so specs regarding "MB/sec" throughput are meaningless -- a physical disk can only do so many random IO operations per second (around 200). IO ops/second are rarely discussed by vendors because it is embarrassing. SSDs, on the other hand, have excellent IO ops and you often here those discussed.

To avoid IO most databases (including Progress) allow you to allocate a big chunk of memory to a cache. Progress calls this the "buffer pool" it is determined by the -B startup parameter. If your -B is less than 500,000 you aren't trying very hard.

If you have successfully avoided disk IO you might then have a CPU bottleneck. Having lots and lots of cores is not helpful to databases. In fact it is harmful once you eliminate the other bottlenecks. This is known as the "too many cores problem".

To ensure data integrity while safely and efficiently permitting concurrent access a database must lock certain shared data structures. One of those structures that often forms a bottleneck when disk IO is removed from the equation is the "LRU chain". LRU stands for Least Recently Used. Progress uses the LRU chain to determine which block can be replaced when a new one is needed -- basically it wants to choose blocks that nobody has used recently so it must keep track of when they are accessed (even for read-only purposes). At its deepest layers this "latching" process (implemented by something called a MUTEX) is single-threaded. (Similar things are true for Oracle and SQL Server too.) In the best case an upper limit is generally reached when the number of real physical cores that are on a single bit of silicon (a "die" or "package") is reached. In your case that might be 4. OpenEdge 10.2A is also getting fairly old -- the LRU issue is addressed in 10.2B service pack 6. 11.3 is the current release.

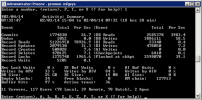
"Latch contention" may, or may not, be your problem. You haven't provided enough information to say. One quick "sanity check" would be to look in PROMON during a period of poor performance and obtain a sample (the "s" command) of the "activity summary" and "performance indicators" screens (found in the R&D, "Activity" sub-menu).

You might just as likely have a very different problem -- you are using ODBC and therefore the SQL-92 engine. Has anyone ever run "update statistics"? The SQL engine uses a cost-based optimizer. Without statistics it cannot form a good query plan and your issue might just be that you have crappy SQL being executed (which would potentially trigger a lot of useless "churn" activity that would drive the excess io or latch contention or both described above).

Or you might just be badly tuned in general.
 
The first bottleneck is usually disk IO ops. Database IO is almost always random, not sequential so specs regarding "MB/sec" throughput are meaningless -- a physical disk can only do so many random IO operations per second (around 200). IO ops/second are rarely discussed by vendors because it is embarrassing. SSDs, on the other hand, have excellent IO ops and you often here those discussed.

We run solely on SSDs.

To avoid IO most databases (including Progress) allow you to allocate a big chunk of memory to a cache. Progress calls this the "buffer pool" it is determined by the -B startup parameter. If your -B is less than 500,000 you aren't trying very hard.

I wasn't able to find the -B parameter in my database .pf file. However, using the fathom tool, under the database default configuration, it is set to 500,000 blocks in database buffers. Is that what you were referring to?

If you have successfully avoided disk IO you might then have a CPU bottleneck. Having lots and lots of cores is not helpful to databases. In fact it is harmful once you eliminate the other bottlenecks. This is known as the "too many cores problem".

I almost laughed out loud when I read this, because our software vendor told us that our 48 core box wasn't big enough...

To ensure data integrity while safely and efficiently permitting concurrent access a database must lock certain shared data structures. One of those structures that often forms a bottleneck when disk IO is removed from the equation is the "LRU chain". LRU stands for Least Recently Used. Progress uses the LRU chain to determine which block can be replaced when a new one is needed -- basically it wants to choose blocks that nobody has used recently so it must keep track of when they are accessed (even for read-only purposes). At its deepest layers this "latching" process (implemented by something called a MUTEX) is single-threaded. (Similar things are true for Oracle and SQL Server too.) In the best case an upper limit is generally reached when the number of real physical cores that are on a single bit of silicon (a "die" or "package") is reached. In your case that might be 4. OpenEdge 10.2A is also getting fairly old -- the LRU issue is addressed in 10.2B service pack 6. 11.3 is the current release.

Interesting. I'm afraid due to the version of our ERP system, we are locked at this exact patch level. 10.2A0329.

"Latch contention" may, or may not, be your problem. You haven't provided enough information to say. One quick "sanity check" would be to look in PROMON during a period of poor performance and obtain a sample (the "s" command) of the "activity summary" and "performance indicators" screens (found in the R&D, "Activity" sub-menu).

upload_2014-2-4_9-44-3.png

You might just as likely have a very different problem -- you are using ODBC and therefore the SQL-92 engine. Has anyone ever run "update statistics"? The SQL engine uses a cost-based optimizer. Without statistics it cannot form a good query plan and your issue might just be that you have crappy SQL being executed (which would potentially trigger a lot of useless "churn" activity that would drive the excess io or latch contention or both described above).

So, one bad SQL call can slow down the entire system?
 

Rob Fitzpatrick

ProgressTalk.com Sponsor
It would also be helpful to know your broker configuration. Are you using a single broker for both SQL and 4GL (AppServer) connections, or separate brokers for each? What are your broker startup parameters?

Slightly OT:
To avoid IO most databases (including Progress) allow you to allocate a big chunk of memory to a cache. Progress calls this the "buffer pool" it is determined by the -B startup parameter. If your -B is less than 500,000 you aren't trying very hard.

If your database and application require that much cache and if you're using the 64-bit database, yes. Unfortunately, that isn't always the DBA's decision. In some cases deployment and application constraints can force the use of the 32-bit database. Example: local clients with dependencies on external 32-bit code, e.g. DLLs.
 

Rob Fitzpatrick

ProgressTalk.com Sponsor
So it looks like you've spent a fair bit on hardware; that's good.
  • How much RAM do you have available?
  • What is your OS?
  • How many other databases run on this box?
  • Are the AppServers local or remote?
  • Does the box have any other application workload, or is it just a database server?
 
It would also be helpful to know your broker configuration. Are you using a single broker for both SQL and 4GL (AppServer) connections, or separate brokers for each? What are your broker startup parameters?

If your database and application require that much cache and if you're using the 64-bit database, yes. Unfortunately, that isn't always the DBA's decision. In some cases deployment and application constraints can force the use of the 32-bit database. Example: local clients with dependencies on external 32-bit code, e.g. DLLs.

We run separate ports for SQL and ODBC. We are running 64-bit on Windows Server 2012.
Are you asking for ubroker.properties?
 
So it looks like you've spent a fair bit on hardware; that's good.
  • How much RAM do you have available?
  • What is your OS?
  • How many other databases run on this box?
  • Are the AppServers local or remote?
  • Does the box have any other application workload, or is it just a database server?

Windows Server 2012.
Only one database runs on this server.
All AppServers are local.
This server has no other workload.

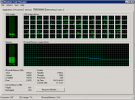
upload_2014-2-4_9-55-0.png
 

Rob Fitzpatrick

ProgressTalk.com Sponsor
A few things from promon:
  • You have a huge number of buffers flushed at checkpoint, and it looks like your BI cluster size is 4 MB or less. What is your BI cluster size?
  • It seems you don't have AI enabled. Is this a production database?
  • Your buffer hit percentage is lousy. With -B 500,000 you either have 2 GB of buffer pool (4 KB DB block size) or 4 GB (8 KB blocks). Given that you have 64 GB of RAM, you can significantly improve your ratio of logical to physical I/O by increasing the size of your buffer pool.
 

Rob Fitzpatrick

ProgressTalk.com Sponsor
We run separate ports for SQL and ODBC. We are running 64-bit on Windows Server 2012.
I guess you know that 10.2A isn't certified by Progress on Server 2012?

Are you asking for ubroker.properties?
I'm asking for the broker startup parameters. They're in that file, but so is a lot of other crap. If you could post the portion of your DB log from the most recent multi-user start (the (333) message) onward, that provides most of the parameters. Please put it within CODE tags; thanks.
 

TomBascom

Curmudgeon
We run solely on SSDs.

The likelihood of latch contention just went up.

I wasn't able to find the -B parameter in my database .pf file. However, using the fathom tool, under the database default configuration, it is set to 500,000 blocks in database buffers. Is that what you were referring to?

I'm sorry to hear that.

You have a 64 bit server. You should get 64 bit OpenEdge to go with it.

I almost laughed out loud when I read this

I'm here all week!

... because our software vendor told us that our 48 core box wasn't big enough...

I thought you said that you have 80 cores?

Interesting. I'm afraid due to the version of our ERP system, we are locked at this exact patch level. 10.2A0329.

Untrue.

The vendor may be telling you that but it is pure bullspit.

If you have source (even encrypted source) and can recompile you can upgrade to any release of OpenEdge and it is very unlikely that you will encounter any problems.

Even if you only have r-code you can upgrade within the same version (version 10 in your case) without issues.

What vendor is feeding you this line of malarkey?

(They are probably saying something like 'our application is "certified" for release x.y' and then heavily implying that they will not support you if you do anything else. That's probably crap too -- try escalating to someone with some common sense...)


You need to sample the data during problematic performance and show the performance indicators screen as well. The average over 18 and half hours is not helpful. Use the "S" command.

So, one bad SQL call can slow down the entire system?

Sure. Bad code can always defeat excellent hardware.

Half a dozen bad SQL calls will do an even better job of slowing things down.

Bad 4gl will do it too.

The ways to make system go slow are pretty much endless... making it go fast is much harder.
 
A few things from promon:
  • You have a huge number of buffers flushed at checkpoint, and it looks like your BI cluster size is 4 MB or less. What is your BI cluster size?
  • It seems you don't have AI enabled. Is this a production database?
  • Your buffer hit percentage is lousy. With -B 500,000 you either have 2 GB of buffer pool (4 KB DB block size) or 4 GB (8 KB blocks). Given that you have 64 GB of RAM, you can significantly improve your ratio of logical to physical I/O by increasing the size of your buffer pool.

BI cluster size is 524288.
AI is not enabled.
I can increase the buffer pool. Somebody told me that it wasn't good if it was too high, so we kept it somewhat conservative.
 

TomBascom

Curmudgeon
You've been getting some "interesting" advice.

The limits on buffer pool are that it should not exceed the size of the database (that would be a pointless waste of RAM) and it should not be so large that it causes excess paging or swapping by the OS. In your case you have 20GB which probably means that you could use 12GB to 16GB for -B safely enough.

Aside from limits there is also a "point of diminishing returns". Once -B is large enough that the "working set" fits comfortably there is very little advantage to making it larger. One indication that you have reached this stage is the "hit ratio". When it is in the 99.95% range then you have /probably/ got to the point where making -B bigger won't help much. 97% is a very, very long ways from 99.95%. Improving the hit ratio just a fraction of a percent generally means doubling -B (it follows an inverse square law...)
 
I guess you know that 10.2A isn't certified by Progress on Server 2012?


I'm asking for the broker startup parameters. They're in that file, but so is a lot of other crap. If you could post the portion of your DB log from the most recent multi-user start (the (333) message) onward, that provides most of the parameters. Please put it within CODE tags; thanks.

Yeah, we know 2012 is not certified.

Code:
[2014/02/03@15:04:38.178-0600] P-9268       T-9264  I BROKER  0: (333)   Multi-user session begin.
 P-9268       T-9264  I BROKER  0: (452)   Login by SYSTEM on batch.
 P-9268       T-9264  I BROKER  0: (5644)  Started for 9450 using TCP IPV4 address 0.0.0.0, pid 9268.
 P-9268       T-9264  I BROKER  0: (8836)  Connecting to Admin Server on port 7841.
 P-9268       T-9264  I BROKER  0: (14262) Successfully connected to AdminServer on port 7841 using TCP/IP IPV4 address 192.168.1.84.
 P-9268       T-9264  I BROKER  0: (8846)  Registered with Admin Server.
 P-9268       T-9264  I BROKER  0: (4234)  Progress OpenEdge Release 10.2A build 1390 SP03 TF29 on WINNT .
 P-9268       T-9264  I BROKER  0: (4281)  Server started by SYSTEM on batch.
 P-9268       T-9264  I BROKER  0: (6574)  Started using pid: 9268.
 P-9268       T-9264  I BROKER  0: (4235)  Physical Database Name (-db): H:\db\mfgsys.
 P-9268       T-9264  I BROKER  0: (4236)  Database Type (-dt): PROGRESS.
 P-9268       T-9264  I BROKER  0: (4237)  Force Access (-F): Not Enabled.
 P-9268       T-9264  I BROKER  0: (4238)  Direct I/O (-directio): Not Enabled.
 P-9268       T-9264  I BROKER  0: (-----) LRU mechanism enabled.
 P-9268       T-9264  I BROKER  0: (4239)  Number of Database Buffers (-B): 500000.
 P-9268       T-9264  I BROKER  0: (9422)  Maximum private buffers per user (-Bpmax): 64.
 P-9268       T-9264  I BROKER  0: (4240)  Excess Shared Memory Size (-Mxs): 201.
 P-9268       T-9264  I BROKER  0: (10014) The shared memory segment is not locked in memory.
 P-9268       T-9264  I BROKER  0: (4241)  Current Size of Lock Table (-L): 4096000.
 P-9268       T-9264  I BROKER  0: (13953) Maximum Area Number (-maxArea): 32000.
 P-9268       T-9264  I BROKER  0: (4242)  Hash Table Entries (-hash): 137743.
 P-9268       T-9264  I BROKER  0: (4243)  Current Spin Lock Tries (-spin): 80000.
 P-9268       T-9264  I BROKER  0: (6526)  Number of Semaphore Sets (-semsets): 3.
 P-9268       T-9264  I BROKER  0: (13924) Maximum Shared Memory Segment Size (-shmsegsize) 4096 Mb.
 P-9268       T-9264  I BROKER  0: (4244)  Crash Recovery (-i): Enabled.
 P-9268       T-9264  I BROKER  0: (6573)  Database Blocksize (-blocksize): 4096.
 P-9268       T-9264  I BROKER  0: (4245)  Delay of Before-Image Flush (-Mf): 3.
 P-9268       T-9264  I BROKER  0: (4247)  Before-Image File I/O (-r -R): Reliable.
 P-9268       T-9264  I BROKER  0: (4249)  Before-Image Truncate Interval (-G): 0.
 P-9268       T-9264  I BROKER  0: (4250)  Before-Image Cluster Size: 524288.
 P-9268       T-9264  I BROKER  0: (4251)  Before-Image Block Size: 8192.
 P-9268       T-9264  I BROKER  0: (4252)  Number of Before-Image Buffers (-bibufs): 25.
 P-9268       T-9264  I BROKER  0: (-----) Record free chain search depth factor 5 (-recspacesearchdepth)
 P-9268       T-9264  I BROKER  0: (9238)  BI File Threshold size (-bithold): 58.6  GBytes.
 P-9268       T-9264  I BROKER  0: (6552)  BI File Threshold Stall (-bistall): Disabled.
 P-9268       T-9264  I BROKER  0: (4254)  After-Image Stall (-aistall): Not Enabled.
 P-9268       T-9264  I BROKER  0: (4255)  After-Image Block Size: 8192.
 P-9268       T-9264  I BROKER  0: (4256)  Number of After-Image Buffers (-aibufs): 25.
 P-9268       T-9264  I BROKER  0: (8527)  Storage object cache size (-omsize): 1024
 P-9268       T-9264  I BROKER  0: (4257)  Maximum Number of Clients Per Server (-Ma): 3.
 P-9268       T-9264  I BROKER  0: (4258)  Maximum Number of Servers (-Mn): 191.
 P-9268       T-9264  I BROKER  0: (4259)  Minimum Clients Per Server (-Mi): 1.
 P-9268       T-9264  I BROKER  0: (4260)  Maximum Number of Users (-n): 441.
 P-9268       T-9264  I BROKER  0: (4261)  Host Name (-H): ZEUS.
 P-9268       T-9264  I BROKER  0: (4262)  Service Name (-S): 9450.
 P-9268       T-9264  I BROKER  0: (14268) TCP/IP Version (-ipver) : IPV4
 P-9268       T-9264  I BROKER  0: (4263)  Network Type (-N): TCP.
 P-9268       T-9264  I BROKER  0: (4264)  Character Set (-cpinternal): iso8859-1.
 P-9268       T-9264  I BROKER  0: (4282)  Parameter File: Not Enabled.
 P-9268       T-9264  I BROKER  0: (5647)  Maximum Servers Per Broker (-Mpb): 140.
 P-9268       T-9264  I BROKER  0: (5648)  Minimum Port for Auto Servers (-minport): 3000.
 P-9268       T-9264  I BROKER  0: (5649)  Maximum Port for Auto Servers (-maxport): 5000.
 P-9268       T-9264  I BROKER  0: (8864)  This broker supports SQL server groups only.
 P-9268       T-9264  I BROKER  0: (9426)  Large database file access has been enabled.
 P-9268       T-9264  I BROKER  0: (9336)  Created shared memory with segment_id: 1
 P-9268       T-9264  I BROKER  0: (12813) Allowed index cursors (-c): 1764.
 P-9268       T-9264  I BROKER  0: (12814) Group delay (-groupdelay): 10.
 P-9268       T-9264  I BROKER  0: (12815) Lock table hash table size (-lkhash): 529259
 P-9268       T-9264  I BROKER  0: (12816) Maxport (-maxport): 5000
 P-9268       T-9264  I BROKER  0: (12817) Minport (-minport): 3000
 P-9268       T-9264  I BROKER  0: (12818) Message Buffer Size (-Mm): 1024
 P-9268       T-9264  I BROKER  0: (12820) Maximum Servers per Broker (-Mpb): 140
 P-9268       T-9264  I BROKER  0: (12821) Use muxlatches (-mux): 1
 P-9268       T-9264  I BROKER  0: (12823) Semaphore Sets (-semsets): 3
 P-9268       T-9264  I BROKER  0: (13870) Database Service Manager - IPC Queue Size (-pica) : 64.0  KBytes.
 P-9268       T-9264  I BROKER  0: (13896) TXE Commit lock skip limit (-TXESkipLimit): 10000.
 P-9268       T-9264  I BROKER  0: (10471) Database connections have been enabled.
 P-11552      T-9636  I SRV     1: (452)   Login by SYSTEM on batch.
 P-11552      T-9636  I BROKER  1: (5644)  Started for 9400 using TCP IPV4 address 0.0.0.0, pid 11552.
 P-11552      T-9636  I BROKER  1: (5645)  This is an additional broker for this protocol.
 P-11552      T-9636  I BROKER  1: (8863)  This broker supports 4GL server groups only.
 P-8864       T-9176  I FMAGEN191: (452)   Login by SYSTEM on batch.
 P-8864       T-9176  I FMAGEN191: (7129)  Usr 191 set name to DB_Agent.
 P-8864       T-9176  I FMAGEN191: (14262) Successfully connected to AdminServer on port 8841 using TCP/IP IPv4 address 192.168.1.84.
 P-8864       T-9176  I FMAGEN191: (8846)  Registered with Admin Server.
 

TomBascom

Curmudgeon
That is a default bi cluster size. It is pretty much always wrong.

You should /start/ by changing it to 16MB. Then see how far apart your checkpoints are. If they are under 1 minute apart during busy periods make it larger.
 
Top