Question Linear & Exponentional Trend Function

Cecil

19+ years progress programming and still learning.
Hi

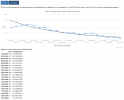
I needed to write a function(s) to a calculation trends for my application to then be plotted onto a chart. I ported some code from JavaScript into the ABL to calculate Linear & Exponentiation trends. If this would be handy for anyone I'll post it on the ProgressTalk.
 

rzr

Member
Thanks Cecil...I'd be interested in learning in the latter part where the data is plotted onto a chart.
How did you accomplish this? Is it done completely within Progress or did you have to use 3rd party tool.
 

Cecil

19+ years progress programming and still learning.
Thanks Cecil...I'd be interested in learning in the latter part where the data is plotted onto a chart.
How did you accomplish this? Is it done completely within Progress or did you have to use 3rd party tool.

My application is web-based and I plot charts using Highcharts (Interactive JavaScript charts for your web pages). Someone created a add-on module for Highcharts to plot trending lines. But I needed the same data on the server side as-well. So I ported the add-on Module (written in JavaScript) to ABL.

Please find attached the regression.i include file and here is a demo code to test the functionality.

Code:
/** UNIT TEST CODE **/

{regression.i}

DEFINE VARIABLE deDATA      AS DECIMAL  EXTENT 200 NO-UNDO.
DEFINE VARIABLE DERETURN    AS DECIMAL  EXTENT     NO-UNDO.

DEFINE VARIABLE inLoop AS INTEGER     NO-UNDO.

etime(true).
DO inLoop = 1 TO EXTENT(deDATA):
    deDATA[inLoop] = RANDOM(1,10).
END.

DEFINE VARIABLE deBase AS DECIMAL     NO-UNDO.
DEFINE VARIABLE decoff AS DECIMAL     NO-UNDO.

EXTENT(DERETURN) = EXTENT(deDATA).

DERETURN = TrendData(INPUT deDATA,
                   INPUT 'Linear',
                   OUTPUT deBase,
                   OUTPUT decoff ).

define stream SOUTPUT.

output stream SOUTPUT TO 'regression.csv'.

DO inLoop = 1 TO EXTENT(deDATA):
    EXPORT STREAM SOUTPUT DELIMITER ',' deDATA[inLoop] DERETURN[inLoop].
END.

OUTPUT STREAM SOUTPUT CLOSE.
 

Attachments

  • regression.i
    5.5 KB · Views: 4

Cecil

19+ years progress programming and still learning.
My application is web-based and I plot charts using Highcharts (Interactive JavaScript charts for your web pages). Someone created a add-on module for Highcharts to plot trending lines. But I needed the same data on the server side as-well. So I ported the add-on Module (written in JavaScript) to ABL.

Please find attached the regression.i include file and here is a demo code to test the functionality.

Code:
/** UNIT TEST CODE **/

{regression.i}

DEFINE VARIABLE deDATA      AS DECIMAL  EXTENT 200 NO-UNDO.
DEFINE VARIABLE DERETURN    AS DECIMAL  EXTENT     NO-UNDO.

DEFINE VARIABLE inLoop AS INTEGER     NO-UNDO.

etime(true).
DO inLoop = 1 TO EXTENT(deDATA):
    deDATA[inLoop] = RANDOM(1,10).
END.

DEFINE VARIABLE deBase AS DECIMAL     NO-UNDO.
DEFINE VARIABLE decoff AS DECIMAL     NO-UNDO.

EXTENT(DERETURN) = EXTENT(deDATA).

DERETURN = TrendData(INPUT deDATA,
                   INPUT 'Linear',
                   OUTPUT deBase,
                   OUTPUT decoff ).

define stream SOUTPUT.

output stream SOUTPUT TO 'regression.csv'.

DO inLoop = 1 TO EXTENT(deDATA):
    EXPORT STREAM SOUTPUT DELIMITER ',' deDATA[inLoop] DERETURN[inLoop].
END.

OUTPUT STREAM SOUTPUT CLOSE.

I'm also thinking about re-writing this code to not use un-assigned variable extents but to user JSON ARRAY objects because I believe there are better at handling larger volumes of data.
 

Cecil

19+ years progress programming and still learning.
Find attached a bit more of a demonstration on how I'm using Highcharts and my regression function.

The ZIP file contains a single html which needs to be called from your WebSpeed environment for it too work correctly.
 

Attachments

  • Regression Trending Lines In WebSpeed.png
    Regression Trending Lines In WebSpeed.png
    59.2 KB · Views: 6
  • PlotTrendLinesTest.zip
    2.2 KB · Views: 6
Top