_proapsv high CPU usage in Redhat 6.6 (Resolved)

chrisds

New Member
Good evening people, need help here.

I'm using Progress 10.2b in Redhat Linux 6.6 (64 bit). when multiple users (50) concurrently login , i notice many _proapsv (Progress Admin service) comes out and each eats between 9% to 11% of CPU, ending up the CPU hits 90%+. each _proapsv takes 5 mins to come out from top. when users keep logging in, it will take up to 60mins for all to clear. is there a setting to quickly let the _proapsv leave ? users are logging in to QAD btw but i just asked users to double to login, no clicking on menu.

My DB Startup Script :

# -B = 10GB RAM = 1000 * 1024 = 10240000 / 8 (8192 blocks DB) = -B 1280000

#/usr/dlc/bin/_dbutil /home/mfg/mfgsvr/db/rkprod -C AIMAGE TRUNCATE
#/usr/dlc/bin/_dbutil /home/mfg/mfgsvr/db/rkprod -C AIMAGE BEGIN

$DLC/bin/_mprosrv /home/mfg/mfgsvr/db/rkprod -L 500000 -c 350 -B 1280000 -S rkprod -H rk.erp -N TCP -n 450 -Mn 44 -Ma 10 -Mi 8 -Mpb 48 -minport 1125 -maxport 4999 -spin 10000
$DLC/bin/_mprosrv /home/mfg/mfgsvr/db/hlprk -L 100000 -c 350 -B 64000 -S hlprk -H rk.erp -N TCP -n 450 -Mn 44 -Ma 10 -Mi 8 -minport 1125 -maxport 4999 -spin 10000
$DLC/bin/_mprosrv /home/mfg/mfgsvr/db/admrk -L 100000 -c 350 -B 64000 -S admrk -H rk.erp -N TCP -n 450 -Mn 44 -Ma 10 -Mi 8 -minport 1125 -maxport 4999 -spin 10000
$DLC/bin/_mprosrv /home/mfg/mfgsvr/db/rkcustom -L 100000 -c 350 -B 64000 -S rkcustom -H rk.erp -N TCP -n 450 -Mn 44 -Ma 10 -Mi 8 -minport 1125 -maxport 4999
$DLC/bin/probiw /home/mfg/mfgsvr/db/rkprod
$DLC/bin/proapw /home/mfg/mfgsvr/db/rkprod
$DLC/bin/proapw /home/mfg/mfgsvr/db/admrk
$DLC/bin/proapw /home/mfg/mfgsvr/db/hlprk


Any help is highly appreciated. i know i've posted few database solutions in this forum but i got stuck here.
Thank you.
 

Rob Fitzpatrick

ProgressTalk.com Sponsor
i notice many _proapsv (Progress Admin service)
Note:
proadsv is the Admin service
_proapsv is a Classic App Server agent

As to what is happening in those App Servers, I don't know. The first thing to do is check your App Server logs.

You might also want to revisit your database parameter values. For example, -Mpb larger than -Mn doesn't make sense. And shared broker port ranges are not a good practice.
 

TomBascom

Curmudgeon
I do not understand this comment:
i just asked users to double to login, no clicking on menu.
What does that mean?

The fact that appservers are running is not, in itself, a problem. They are, presumably, doing something of value for the users of the application.

The bit about taking 5 minutes to "clear" is also not obviously a problem. Is there some particular baseline time that you expect them to finish in? Are they performing some known task that you can measure the success of?

I also don't understand the link between users logging in and something then taking 60 minutes. Could you elaborate on that please?

The fact that you are consuming 90%+ of the available CPU is also, in itself, not a problem. The bean-counters probably consider that excellent resource utilization and are probably currently patting themselves on the back for optimizing their infrastructure investment.

You did not specify how many CPUs this system has. Could you clarify that please? And maybe provide some basic description of the overall system?

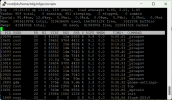
Looking at your screen capture the CPU utilization also seems reasonably well-balanced. None of them are hogging whole CPUs and the ratio of %usr to %sys is normal. Other processes are in the top 10 so nobody seems to be starving for CPU time.

Is there an actual problem? Are users reporting wait times? Is something taking longer to complete than you would like?

Regarding your startup script, aside from Rob's comments:

I am very glad to see that you are not restarting after-imaging at each startup. That's a bad thing to do - it limits your recoverability substantially. However the lack of an AIW being started suggests that you are running without after-imaging. If so, that is irresponsible. You are needlessly risking data loss. That should be fixed immediately. Implementing after-imaging with the ai management daemon is dead simple.

You are also only starting a BIW for the rkprod database. You should start a BIW for every database. (And start an AIW for every database as well, after enabling after-maging if you have not already done so.) Every database should have a BIW, an AIW, and at least one APW. High activity databases might need a second APW. It is very unlikely that you will ever need more than two APWs. It is helpful, but less critical, to also start a WDOG for every database.

Above, you said that you are running 10.2B. Is that patched? "cat $DLC/version" to reveal the complete release level. 10.2b08 was the last service pack for 10.2b and it is the release that anyone on OpenEdge 10 should be running. (There are hotfixes beyond 10.2b08 but, at a minimum, you should be on 10.2b08.)

Lastly, I see "gnome-setting-" in the process list. This suggests to me that someone has a GUI running on a database server. That is not optimal. I suggest that you get rid of that.
 

chrisds

New Member
Morning Tom, thanks for your reply. My problem here is when concurrent users login at the same time, the _proapsv takes up to 10mins to release and as users keep logging in, it takes up to 60mins to release and CPU usage is up to 95%. Then users are unable to login and start to get errors. I'll start biw and watchdog to test it out. The /usr/dlc/version shows 10.2b.

i just asked users to double to login, no clicking on menu. <- i meant users just login to database. Don't need to run any QAD menu.

i have a question further to this :

This server has 6 databases :

1. Database 1 - 5 users
2. Database 2 - 10 users
3. Database 3 - 10 users
4. Database 4 - 70 users
5. Database 5 - 50 users
6. Database 6 - 100 users

All databases starts at the same time. The database above rkprod is database 6 - 100 users. Questions :

Do i for each database startup scripts -n 250 (combined all logins), -Mn and -Ma to have combined all logins or individual ?

Example, do i put :

-n 450 -Mn 44 -Ma 10 -Mi 8 (to combine all databases users) or
-n 100 -Mn 20 -Ma 5 -Mi 1 (for individual database) ?

FYI when rkprod runs on one server alone, the logins are still tolerable. After 10mins all users are in and clear. That server is 8yrs old with 64GB RAM. I migrated all 6 databases to a much more powerful server.

The server has 256GB of memory. Does increasing the -B to 50GB memory helps ?

Thank you sir.
 
Last edited:

chrisds

New Member
Note:
proadsv is the Admin service
_proapsv is a Classic App Server agent

As to what is happening in those App Servers, I don't know. The first thing to do is check your App Server logs.

You might also want to revisit your database parameter values. For example, -Mpb larger than -Mn doesn't make sense. And shared broker port ranges are not a good practice.
thanks for your advice Rob
 

TomBascom

Curmudgeon
double to login, no clicking on menu. <- i meant users just login to database. Don't need to run any QAD menu.

How does one manage to "login to the database" without running a QAD menu? Doesn't the QAD main menu appear as a result of successfully logging in? Are you just saying that the idea is to just login and not select anything from that menu?

This comment is also interesting:

Then users are unable to login and start to get errors.

Mentioning "errors" without any details, like the error number and the actual text of the error message, is bad form. Please supply the error numbers and the actual text of the errors.

You are using a term "release" which, so far as I know, is not a commonly used word to describe anything that is related to your problem description. I am *guessing* that you are saying that when a user logs in some part of the login code appears to make one or more synchronous appserver calls and the login process does not complete for a substantial amount of time. When multiple users login simultaneously (or nearly so) the login process takes longer for each user as the number of concurrent users increases. Is that correct?

Aside from trawling through the appserver log files looking for anything glaringly obvious (you should definitely do that and look in the dabase log file too) there are few other things that you can do to get a better handle on where things might be going wrong. One easy thing to do is to run "proGetStack". This command will dump a 4gl stack trace which would then allow you to examine the code and determine if there is something that needs to be addressed in the code. You need to be "root" to run proGetStack and you will need the process id of the session. Since you apparently have many logins that take multiple minutes to complete it should not be too difficult to pick a couple and see what is going on.

You want to *start* with the _progres executable that a user is running to login. None of those are showing in your screen capture above (which makes sense - if they are waiting for a reply from an appserver, they would be sleeping and thus not be in the "top" running processes...) so you will have to extract the target PID by knowing something else about the session. Maybe the username or the TTY that they are logging in to or the IP address that they are coming from.

Once you know the PID:

Code:
proenv> proGetStack 123456

That will create a file called protrace.123456 (the PID is appended) in the working directory that _progres was launched from (often the users home directory but it could be somewhere else depending on how your login scripts work). Inside that file will be a a line starting with "--> ". That is the currently executing line of 4gl code. You can skip straight to the answer with:

Code:
proenv  grep '\-\-> ' protrace.123456

That line number is the DEBUG LIST line number not the source line number. You will need to compile the relevant dot-p with the DEBUG LIST option to navigate to that line.

You can run proGetStack on a process multiple times. Each time that you run it the protrace will be appended. It can be helpful to do this in order to determine if the code is really blocked on a particular line or if it is executing various bits of logic. If my *guess* above is correct and you are waiting for an app server call to return then I would expect the line number is not going to change while you are waiting.

Once you know what line you are waiting on you can then consider next steps. Or maybe you determine that you are NOT waiting for something but, rather, some other logic is executing. Either way you will be better informed about your next steps. Taking the *guess* to its next logical step, if confirmed that an app server call is what we are waiting for, you would then want to run proGetStack on the corresponding _proapsv to find out what is going on there. (Although that might be obvious once you know what line of code called the appserver.) There is probably something in one of the appserver logs that will "connect the dots" between your process that made the call and the process id for the _proapsv which is executing it.[/code]
 

TomBascom

Curmudgeon
Aside from waiting on appserver calls you could also be waiting on other things like record locks, reads from sockets, operating system commands and a plethora of other things. So don't bet everything on it being an app server problem until you have some hard evidence that that is true.

The appserver code could also be waiting on any of those other things. Or it could be doing something ridiculous like using the Gregory-Leibniz series to calculate pi out to 10 or 20 digits (trust me, that isn't at all efficient).

You could, of course, also download ProTop from protop.com to quickly see if there are any obvious issues with record locks resulting in blocked clients. Or other bad behaviors on the database side of things that may explain some of your issues.
 

TomBascom

Curmudgeon
The reported error might be related to this kbase: Progress Customer Community

Note that the recommended resolution is to upgrade to at least 10.2b04. 10.2b08 is the last release of OpenEdge 10 and that is what I would target.

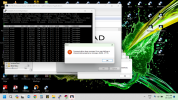
I see what look like additional error messages hidden behind other windows. For all I know those might also be relevant.
 

chrisds

New Member
hi Tom and Rob, first of all i thank you for the supports you gave given me. At last after many months, i found the mistake i've made. The Redhat is running on one CPU after using mpstat -P ALL. I've adjusted the CPU usage to 8 due to 8 cores and setup hyper threading to it. now the CPU usage doesn't even go above 50%. thanks so much.
 
Top