
A
Austin Hellman
Guest
OData, “SQL for the Web,” is REST-based and enables anyone to query data over the web. We leveraged SF OpenData’s OData feed and visualized it in PowerBI.
We gave you a guide to OData and information on getting started. But, how can you actually use it? Is it as easy as we say it is? We explore these questions with a fun example from San Francisco’s OData feed, “Film Locations in San Francisco.” They are just one of many examples of local and federal governments leveraging open data for transparency and business value. With this tutorial, you can leverage OData and start creating valuable visualizations in under 10 minutes.
Before You Begin
Before you start, you will need a tool that can utilize an OData feed. Some common tools are Excel (2010 and after), Microsoft PowerQuery and Microsoft PowerBI. Today, I will be using PowerBI, if you would like to follow along, grab a free trial of the tool here.
Note: If you would like to create an OData API for any cloud app or database yourself, learn how in our Hybrid Connectivity page.
Adding Your OData Feed
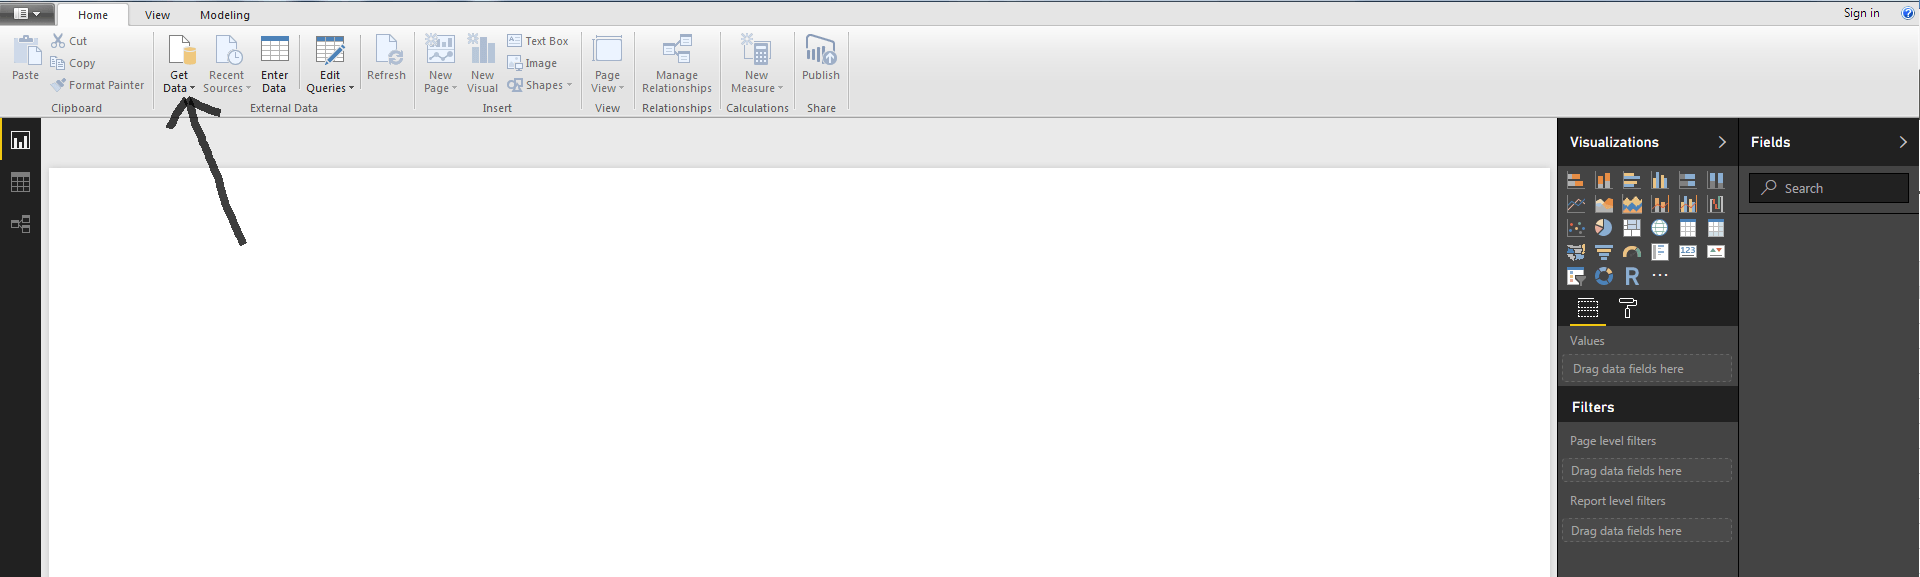
In the PowerBI interface, you will need to begin by adding your OData Feed. In the home ribbon, click on the box that says “Get Data.”
From here, you will choose “OData Feed,” and get prompted to add the feed in this box.
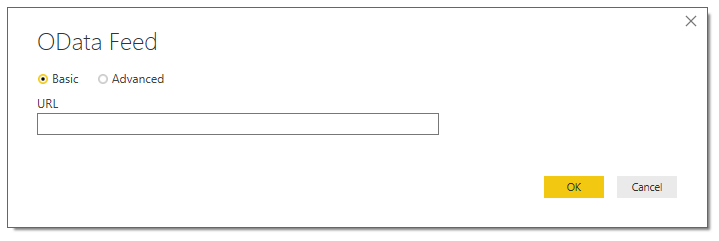
Go ahead and add fill in the OData endpoint for SF Open Data, https://data.sfgov.org/OData.svc/yitu-d5am, and hit OK.
Loading and Editing the Data
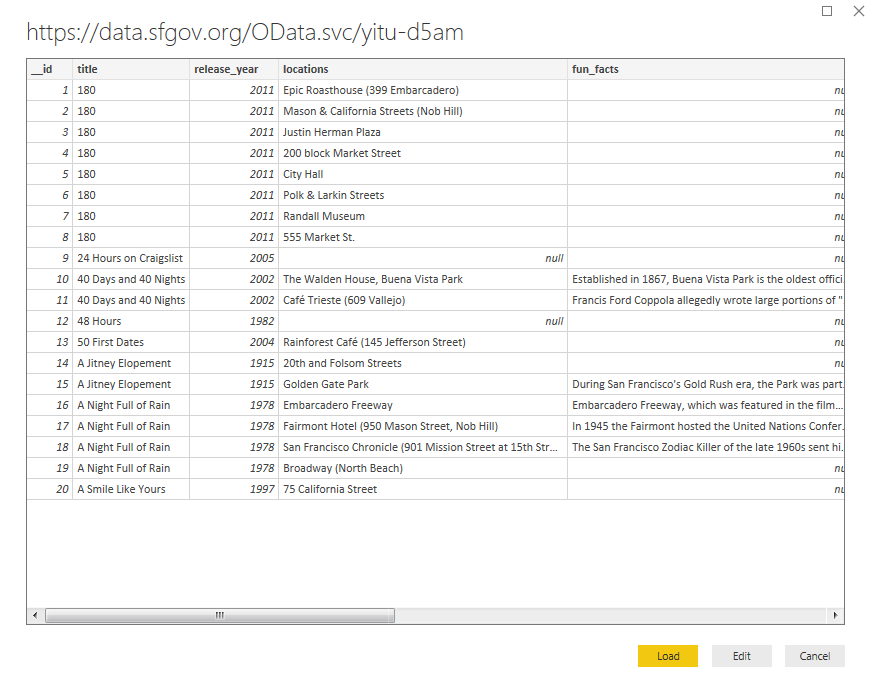
Once you have your OData endpoint set, you will see a preview screen where you can view the rows and columns you are adding. Hitting the edit button allows you to parse your data and choose only what you want or need. In my case, I deleted the “fun_facts” column because it was not an easy column to visualize (due to it being non-formatted sentences).
If you are dealing with a larger data set, you will want to be sure to only load the data that you need. Depending on backend architecture (more on this later), the load time can vary dramatically between downloading a whole data set versus a filtered list. Once you are done editing your data, hit the load button and apply your query.
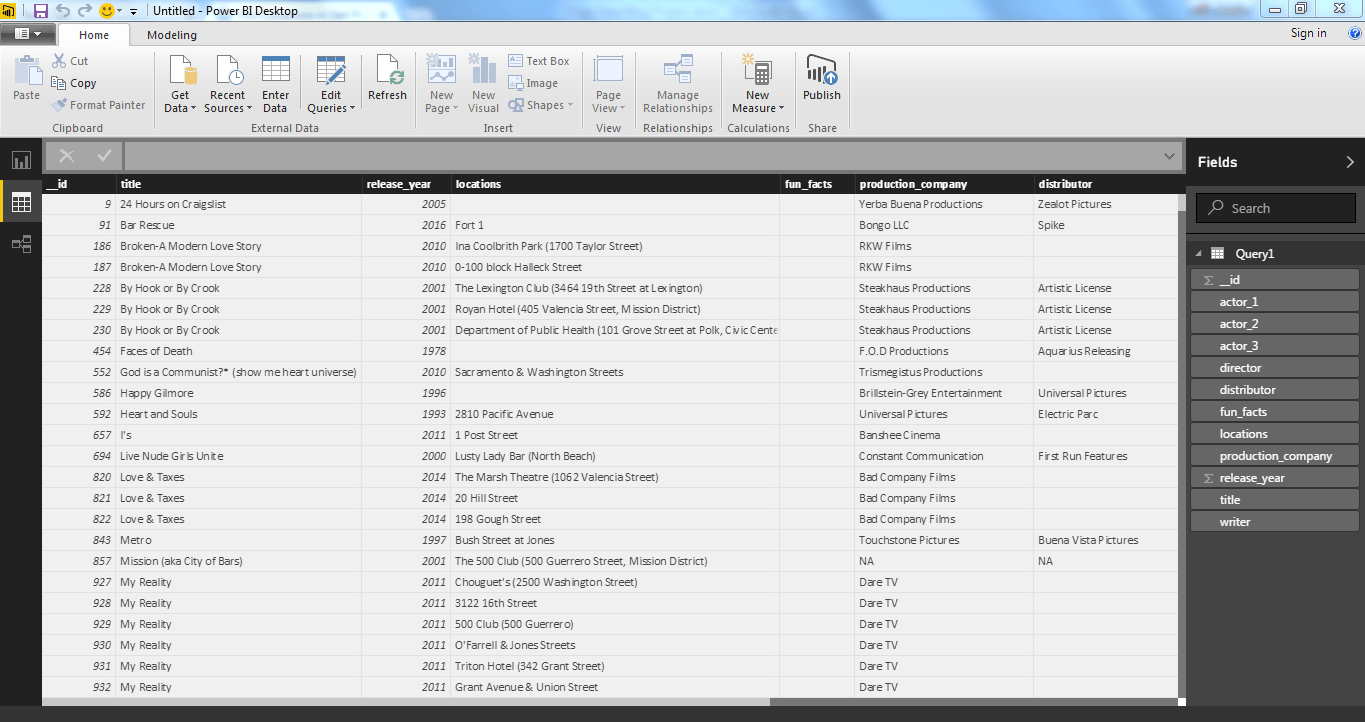
Once your data has loaded, you should see your data loaded into the data view of PowerBI and it should look like this:
Visualizing Your Data
Now is the fun part, let’s visualize the data we just brought in through the OData feed! Due to most of this dataset being string variables, I used treemaps and pie charts. I also leveraged the location data and visualized the filming locations within San Francisco using the map visualization.
Count of Locations by Director
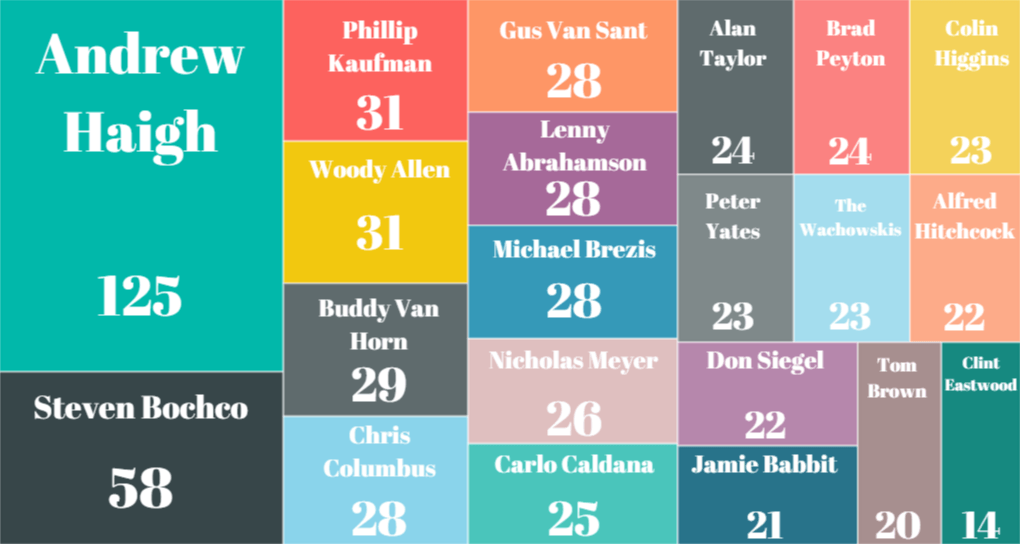
In this visualization, we can see the top film directors based on the number of locations they have filmed in San Francisco. Notice some of the big names! Woody Allen, the Wachowskis, Clint Eastwood, Alfred Hitchcock to name a few. When I saw this list, I was curious on why Andrew Haigh had so many film locations as opposed to more popular directors. It turns out that this list also includes episodes for TV shows, and the top positions were shows based in San Francisco.
Count of Locations by Title
In this visualization, we leveraged PowerBI’s pie chart visualization to see which titles had the most filming locations in the city. We can see how this chart relates to the count of locations by director in that Andrew Haigh’s show “Looking,” is the most popular on this list. Are any of these movies or shows top on your list to watch soon? Let us know in the comments, I am always looking for suggestions!
Film Locations
In this visualization, I used the “Maps” to visualize all of the data in the location column on Bing Maps. One issue I ran into with this that is worth noting is that the formatting is not formatted like a normal address with numbers and zip codes. This caused some of the locations to be seen in multiple places in the US, so I decided to only show the locations that were specifically found in San Francisco.
Experiment with More Public Feeds
If you want more public data feeds to experiment with, the list below is a great place to start! OData.org has a great list as well in their “live services” section.
Our hybrid connectivity services—DataDirect Cloud and Hybrid Data Pipeline—can help you RESTify your database via OData. We support a wide range of data sources including EMR Hive, Cloudera, IBM DB2, SQL Server, Oracle, Postgres, Hubspot and Marketo. You can find the entire list on our OData page.
Both DataDirect Cloud and Hybrid Data Pipeline enable you to access cloud data on premises, behind the firewall through a single standard interface (ODBC, JDBC or OData). Want to learn more? Check out our Hybrid Connectivity Page for more details. Have any questions? Please comment or give us a call!
Create an OData API Now
Continue reading...
We gave you a guide to OData and information on getting started. But, how can you actually use it? Is it as easy as we say it is? We explore these questions with a fun example from San Francisco’s OData feed, “Film Locations in San Francisco.” They are just one of many examples of local and federal governments leveraging open data for transparency and business value. With this tutorial, you can leverage OData and start creating valuable visualizations in under 10 minutes.
Before You Begin
Before you start, you will need a tool that can utilize an OData feed. Some common tools are Excel (2010 and after), Microsoft PowerQuery and Microsoft PowerBI. Today, I will be using PowerBI, if you would like to follow along, grab a free trial of the tool here.
Note: If you would like to create an OData API for any cloud app or database yourself, learn how in our Hybrid Connectivity page.
Adding Your OData Feed
In the PowerBI interface, you will need to begin by adding your OData Feed. In the home ribbon, click on the box that says “Get Data.”
From here, you will choose “OData Feed,” and get prompted to add the feed in this box.
Go ahead and add fill in the OData endpoint for SF Open Data, https://data.sfgov.org/OData.svc/yitu-d5am, and hit OK.
Loading and Editing the Data
Once you have your OData endpoint set, you will see a preview screen where you can view the rows and columns you are adding. Hitting the edit button allows you to parse your data and choose only what you want or need. In my case, I deleted the “fun_facts” column because it was not an easy column to visualize (due to it being non-formatted sentences).
If you are dealing with a larger data set, you will want to be sure to only load the data that you need. Depending on backend architecture (more on this later), the load time can vary dramatically between downloading a whole data set versus a filtered list. Once you are done editing your data, hit the load button and apply your query.
Once your data has loaded, you should see your data loaded into the data view of PowerBI and it should look like this:
Visualizing Your Data
Now is the fun part, let’s visualize the data we just brought in through the OData feed! Due to most of this dataset being string variables, I used treemaps and pie charts. I also leveraged the location data and visualized the filming locations within San Francisco using the map visualization.
Count of Locations by Director
In this visualization, we can see the top film directors based on the number of locations they have filmed in San Francisco. Notice some of the big names! Woody Allen, the Wachowskis, Clint Eastwood, Alfred Hitchcock to name a few. When I saw this list, I was curious on why Andrew Haigh had so many film locations as opposed to more popular directors. It turns out that this list also includes episodes for TV shows, and the top positions were shows based in San Francisco.
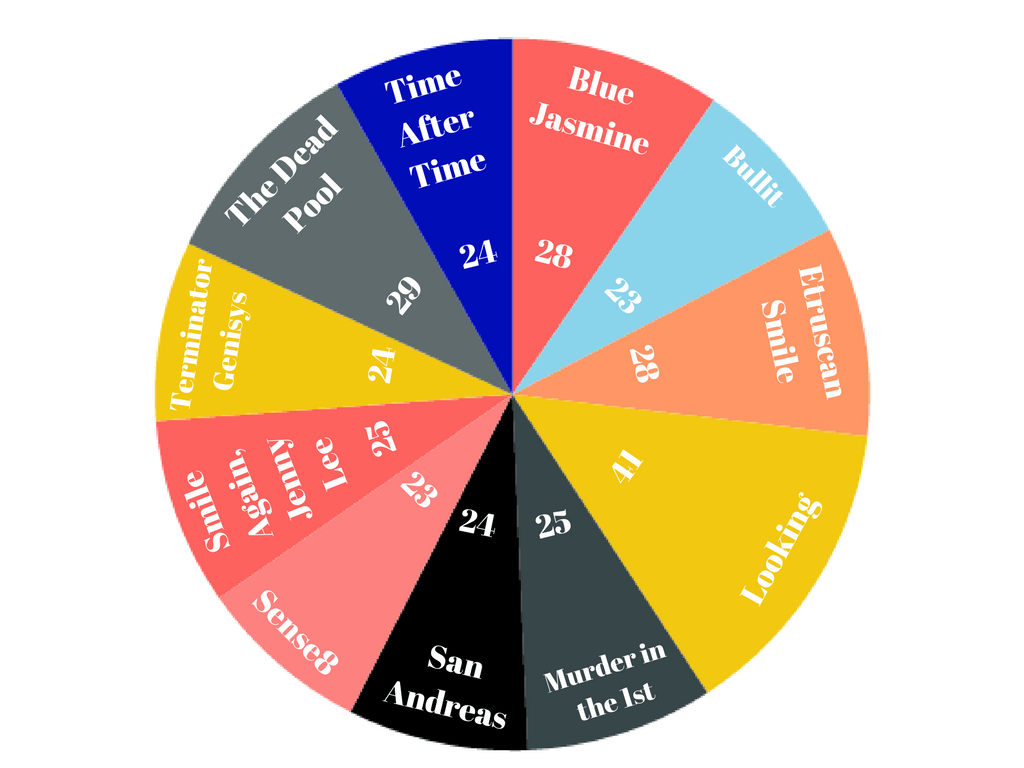
Count of Locations by Title
In this visualization, we leveraged PowerBI’s pie chart visualization to see which titles had the most filming locations in the city. We can see how this chart relates to the count of locations by director in that Andrew Haigh’s show “Looking,” is the most popular on this list. Are any of these movies or shows top on your list to watch soon? Let us know in the comments, I am always looking for suggestions!
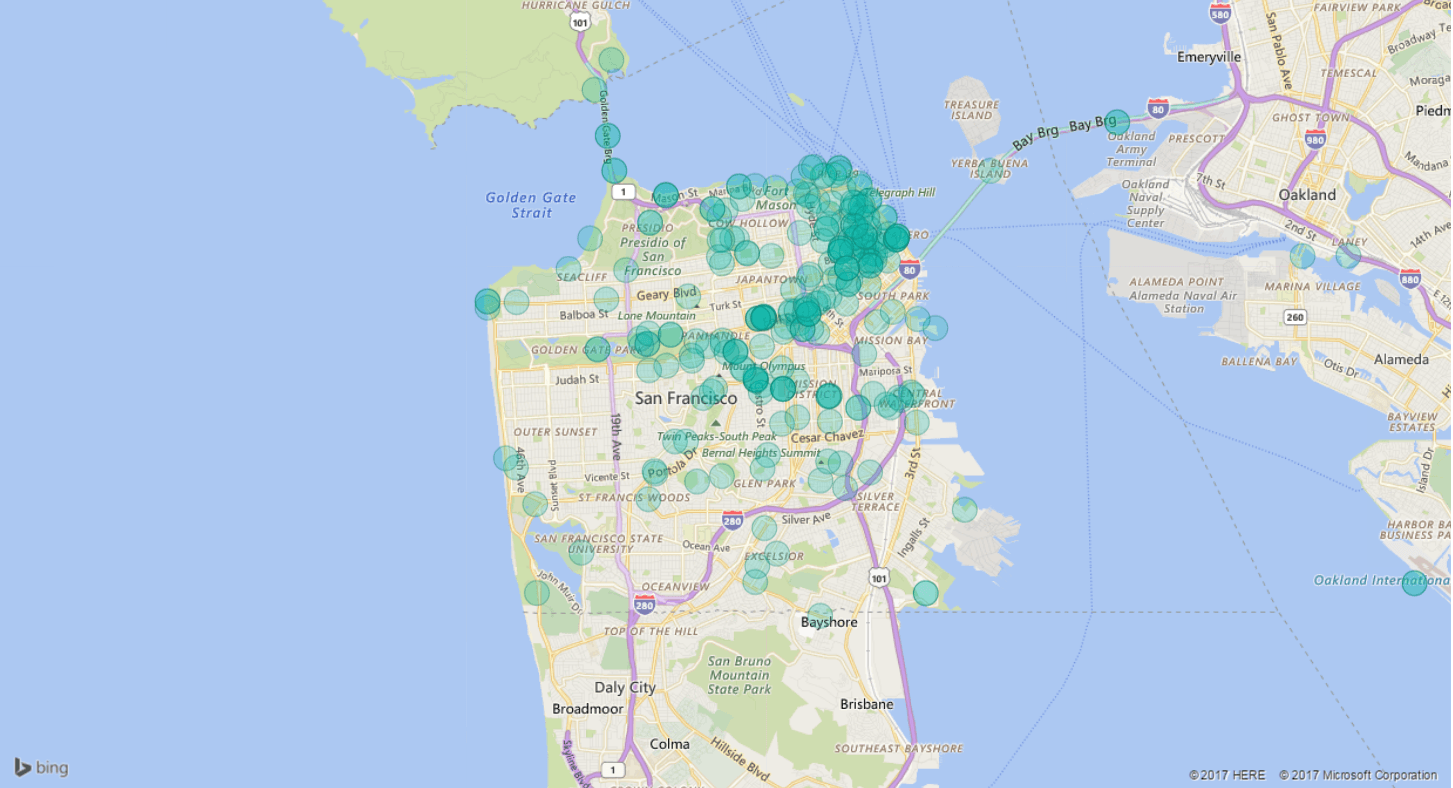
Film Locations
In this visualization, I used the “Maps” to visualize all of the data in the location column on Bing Maps. One issue I ran into with this that is worth noting is that the formatting is not formatted like a normal address with numbers and zip codes. This caused some of the locations to be seen in multiple places in the US, so I decided to only show the locations that were specifically found in San Francisco.
Experiment with More Public Feeds
If you want more public data feeds to experiment with, the list below is a great place to start! OData.org has a great list as well in their “live services” section.
- Whitehouse Visitor Records
- Scottsdale Arizona Municiple Data
- Worldbank Open Data
- Nerddinner OData Feed
- San Francisco Film Location Data
- Cambridge Wearther
Our hybrid connectivity services—DataDirect Cloud and Hybrid Data Pipeline—can help you RESTify your database via OData. We support a wide range of data sources including EMR Hive, Cloudera, IBM DB2, SQL Server, Oracle, Postgres, Hubspot and Marketo. You can find the entire list on our OData page.
Both DataDirect Cloud and Hybrid Data Pipeline enable you to access cloud data on premises, behind the firewall through a single standard interface (ODBC, JDBC or OData). Want to learn more? Check out our Hybrid Connectivity Page for more details. Have any questions? Please comment or give us a call!
Create an OData API Now
Continue reading...